EC Dashboard
The Enterprise Console provides the ability to present the data from multiple Runecast Analyzer instances in a single pane of glass. Each Analyzer deployment has integrated this feature. To enable it, navigate to Settings > Enterprise Console.
Once the EC has been enabled, a new section designated for this feature will appear on the top left side. By default, the EC Dashboard will show all the local Systems added to the Analyzer (Local Analyzer). To manage the local Systems, navigate to Connections tab in the Settings menu. To add a remote Analyzer to EC, just click on the dedicated button located on the top right side of the screen. Provide the FQDN or IP address, the Port and the API token which should be generated on the remote Analyzer. Press the Connect button to finalize the process.
The information about each System of each remote Analyzer are presented in a table view.
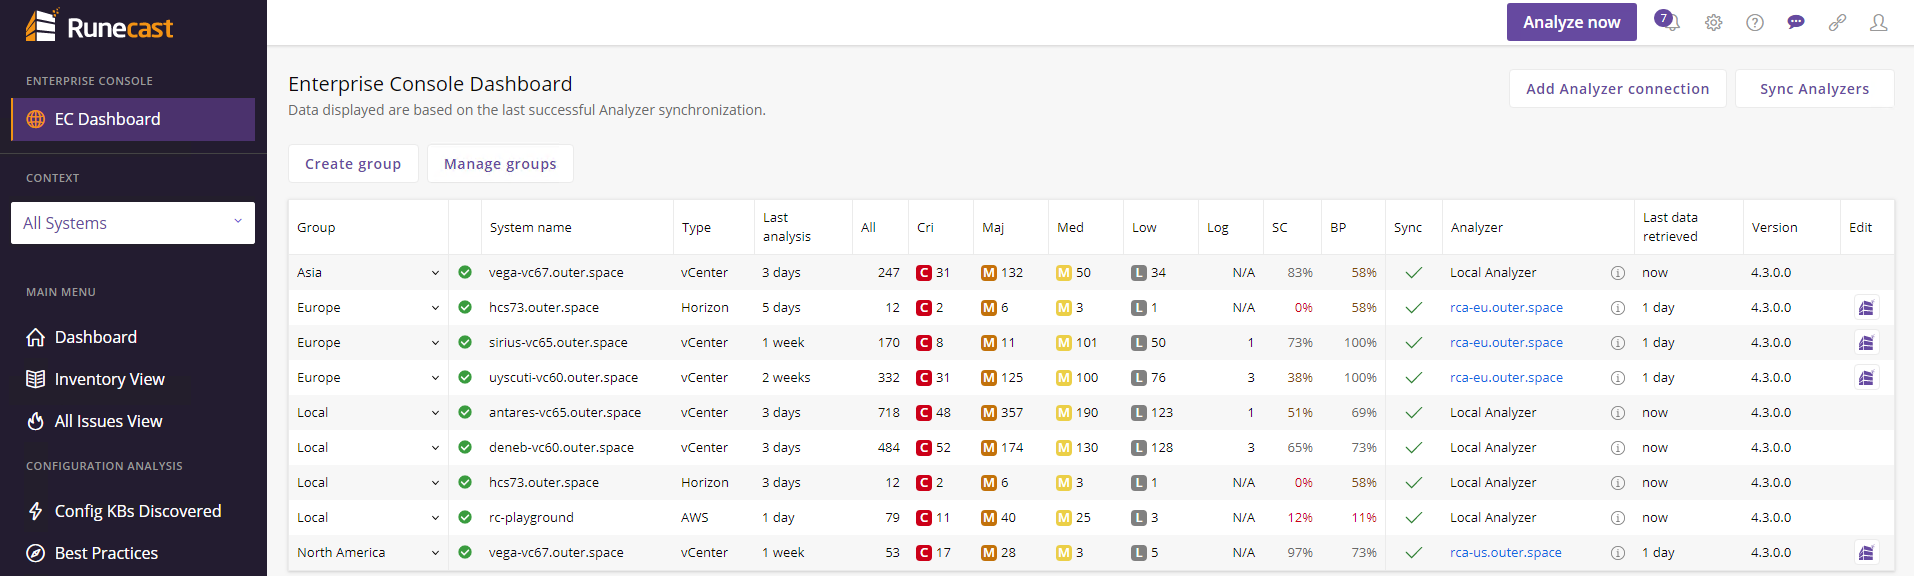
Each System can be allocated to a specific group. To create a group just click on the Create group button and insert the desired name. If the System is not allocated to any group, the Unassigned badge is set. Click on the badge and select a different group from the ones created if a new assignment is required. You can rename or delete a group using Manage groups button.
System name column will show the name of the Systems belonging to the Analyzers added to EC. Their connection status is displayed by the  or
or  icons. The status corresponds to last sync data.
The next columns are providing the system Type, the time of the Last analysis, All configuration issues and their criticality, as well as the Log issues discovered, Security Compliance status and Best Practices adoption.
The Local Analyzer will retrieve all the time the most updated data, based on the last scan. For the remote Analyzers, a successful Sync will be indicated by  icon, and the Last data retrieved will show when it happened. To trigger a sync of all remote Analyzers, click on the Sync Analyzers button located on the top right corner.
By clicking the name of any remote Analyzer, under the Analyzer column, you will be redirected to a new browser tab. The connection and authentication to that instance will be done automatically.
The Version column will present each Analyzer’s Definitions version. On hover both information about application and definition version are displayed.

If specific changes like Analyzer address, API token or Port should be performed, the Edit column allows these actions once you click on the  icon. Removal of any Analyzer can be triggered also from here.