Main Menu
Contains three subsections presenting an overview of the environment, issues discovered and history trend.
Dashboard
The Runecast Analyzer Main Dashboard is the central page that provides a summary of your virtual environment and detected issues. Navigate to the Runecast Analyzer Web Interface URL https://<appliance IP> and login with valid credentials.
Tip
By default, the local user credentials are as follows:
- Username:
rcuser - Password:
Runecast!
If you have configured Runecast Analyzer to use Active Directory then you can use an Active Directory account. Make sure to specify the username in one of the following formats:
<username><username@domain.com>
The Dashbaord, shows the following components for one or multiple systems, based on the selected Context:
- Last 10 Analyses
- Knowledge Profile Results
- Configuration Drift
- All Systems
- Top Issues
- Runecast Updated
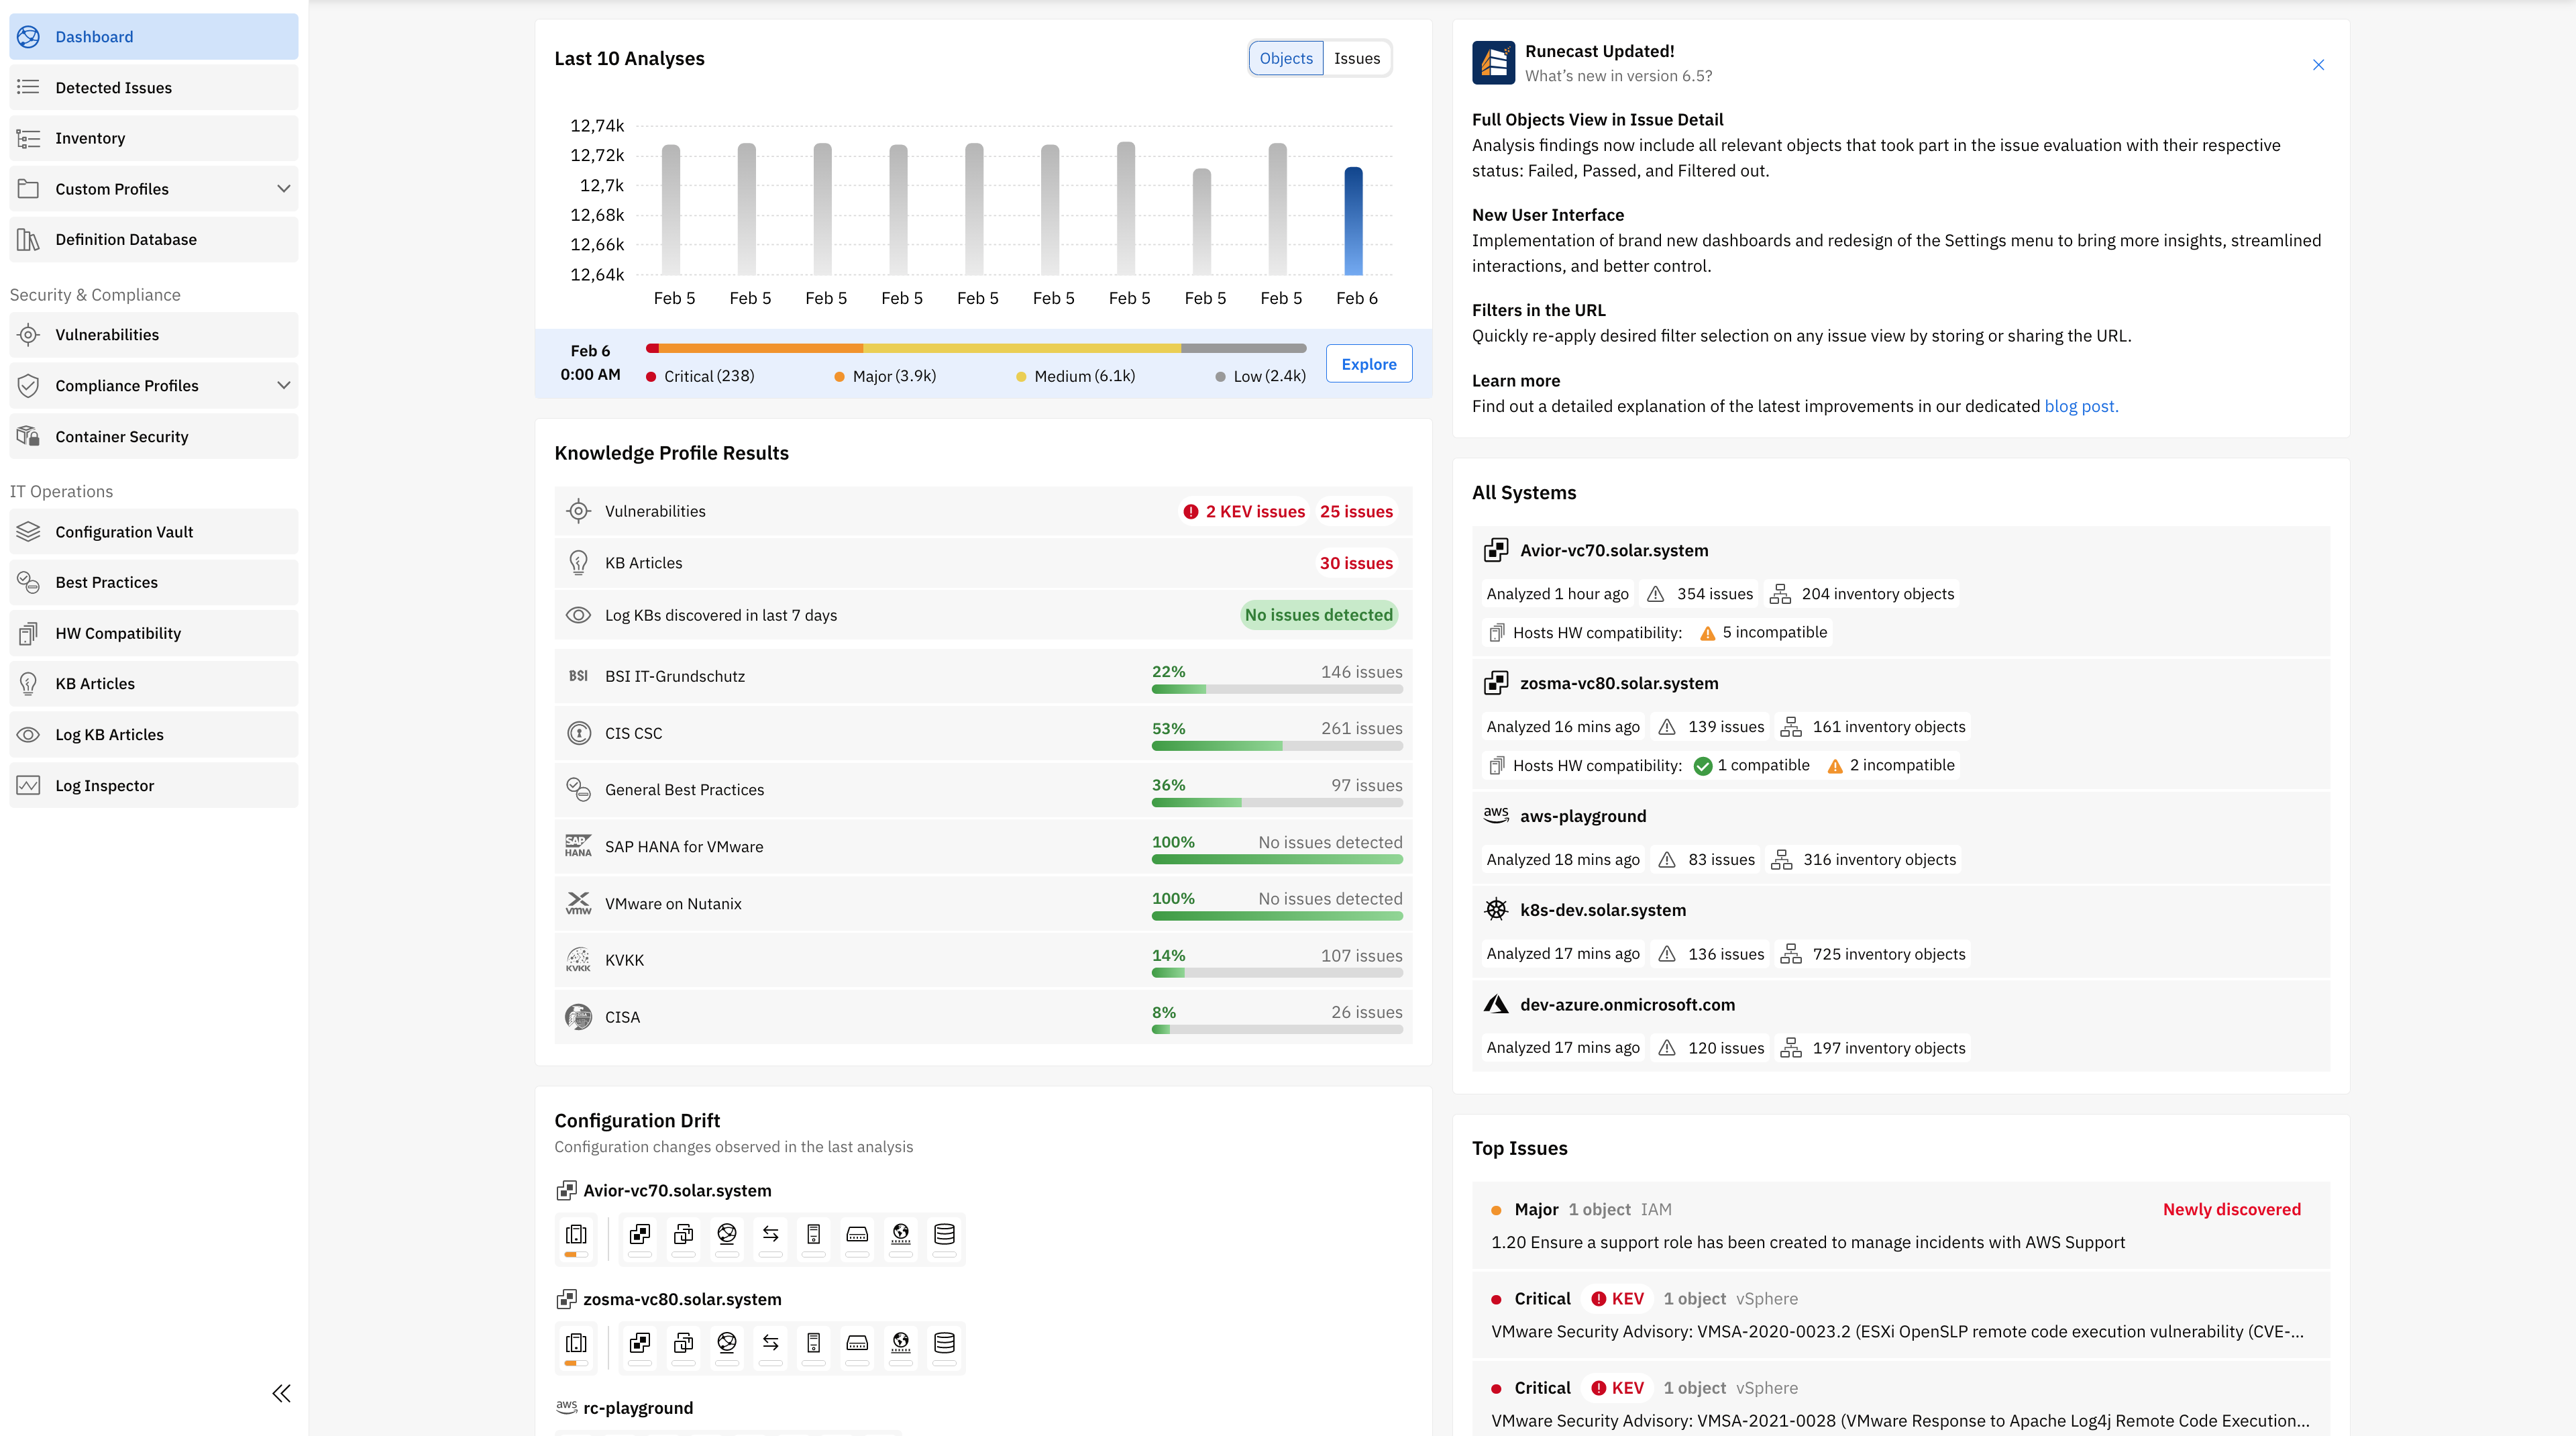
Last 10 Analyses
Displays the evolution of all detected issues in the last ten analyses. This widget provides the option to either check the total number of objects affected or the number of issues. By clicking the Explore button, you will land in the “Detected Issues” view where you can see details for all issues.
Knowledge Profile Results
users will be able to detect at a glance the number of issues that are affecting their systems. The issues are classified by:
- Vulnerabilities: the total number of CVEs discovered in the environment and how many of them are marked as KEVs (Known Exploited Vulnerabilities). On interaction with any of the lables, Runecast will load a filtered view depending on the selected option.
- KB articles: the total number of applicable VMware Knowledge Base articles proactively discovered in the environment.
- Log KBs discovered in the last 7 days: this applies to VMware environments and highlights the total number of issues related to log entries received from your ESXi hosts and VMs.
- Compliance Profiles: easily spot the number of issues related to a specific security standard, along with the impact it has on the analyzed environments. The impact bar shows the number of failed, not answered, and passed issues.
Configuration Drift
This widget provides a quick overview of the information related to any configuration drift in the last two analyses. Hover the mouse over the icons to get detailed information related to the configuration changes made on the selected system(s).
All Systems
Provides rapid access to an overview of each of the systems in the current context. For vCenter Server systems, this widget also shows the number of both incompatible and compatible hosts, providing more context to hardware compatibility information.
Top Issues
This widget highlights the most critical issues discovered in the last two analyses and those that are newly discovered. Users can click on them to check the details of each issue and the systems affected.
Runecast Updated
Shows a summary of the last applied update. It includes links to the user guide when any action is required.
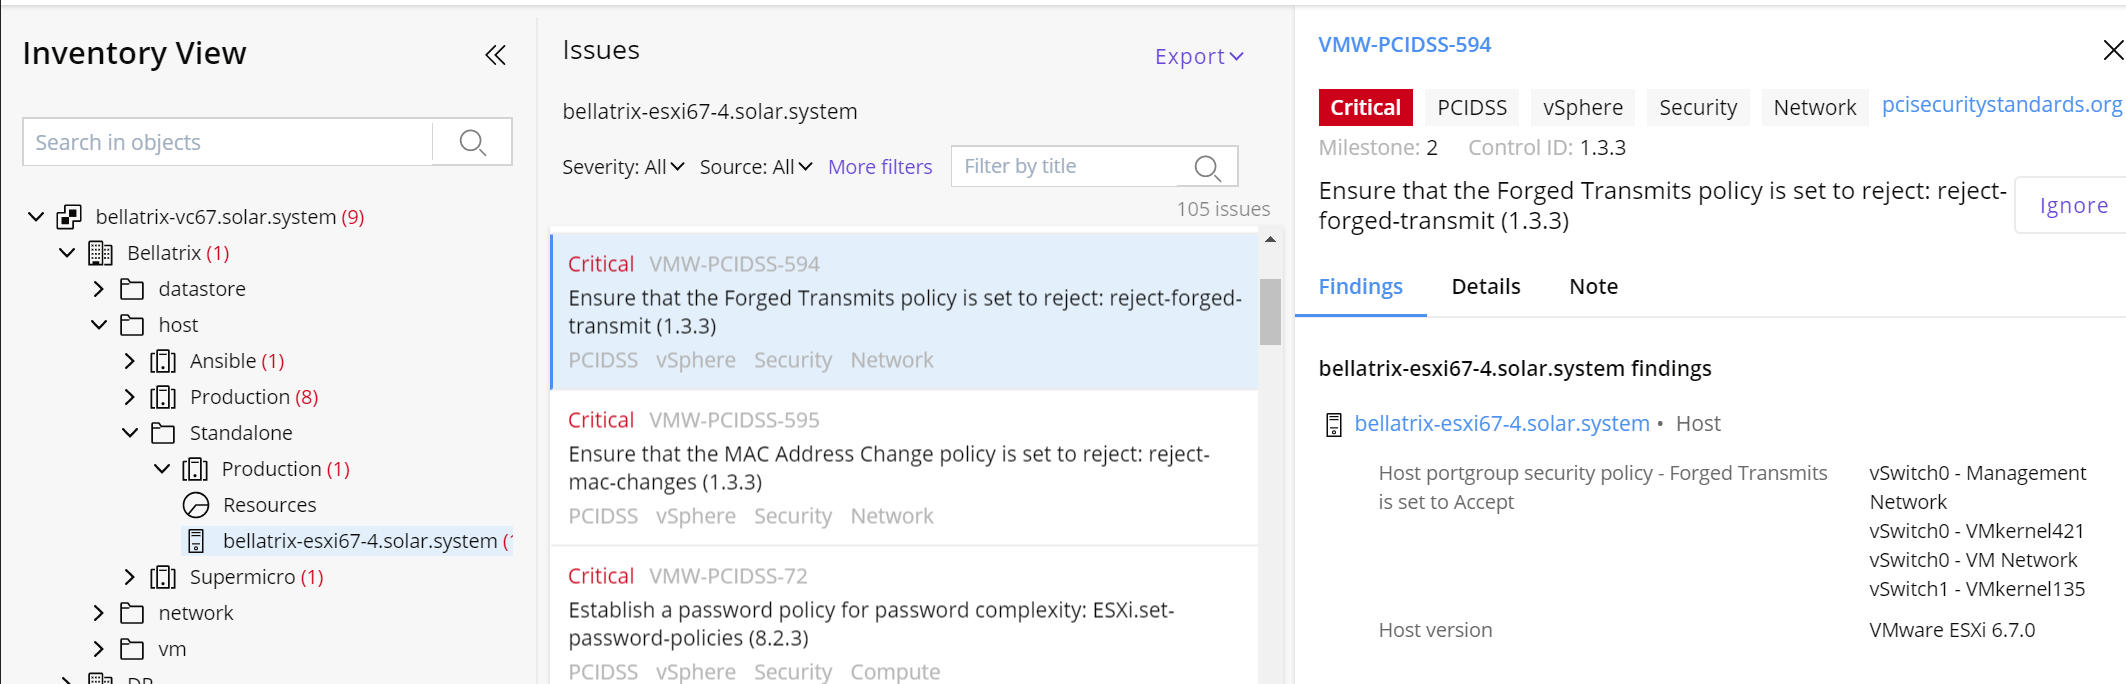
Inventory
Browse through your virtual infrastructure objects hierarchically using the Inventory feature located in the left side of the page. The number of detected issues is shown alongside inventory objects in the tree-view structure. Click on an object to open a detailed list of associated issues. The new list will display on top, apart from the object name, multiple filters to customize it but also a search box and an Export button. To see additional details, select any of the displayed issues by clicking on it. Another section will be revealed presenting information regarding findings, description, notes. Use the Ignore button if you want to filter out the current issue against the selected inventory object.
Info
In rare cases, due to permissions inconsistency, it may not be possible to place some analysis objects under their respective parent objects. In such cases, they can be found under the auto generated folder called Orphaned objects in the root of the system inventory tree.
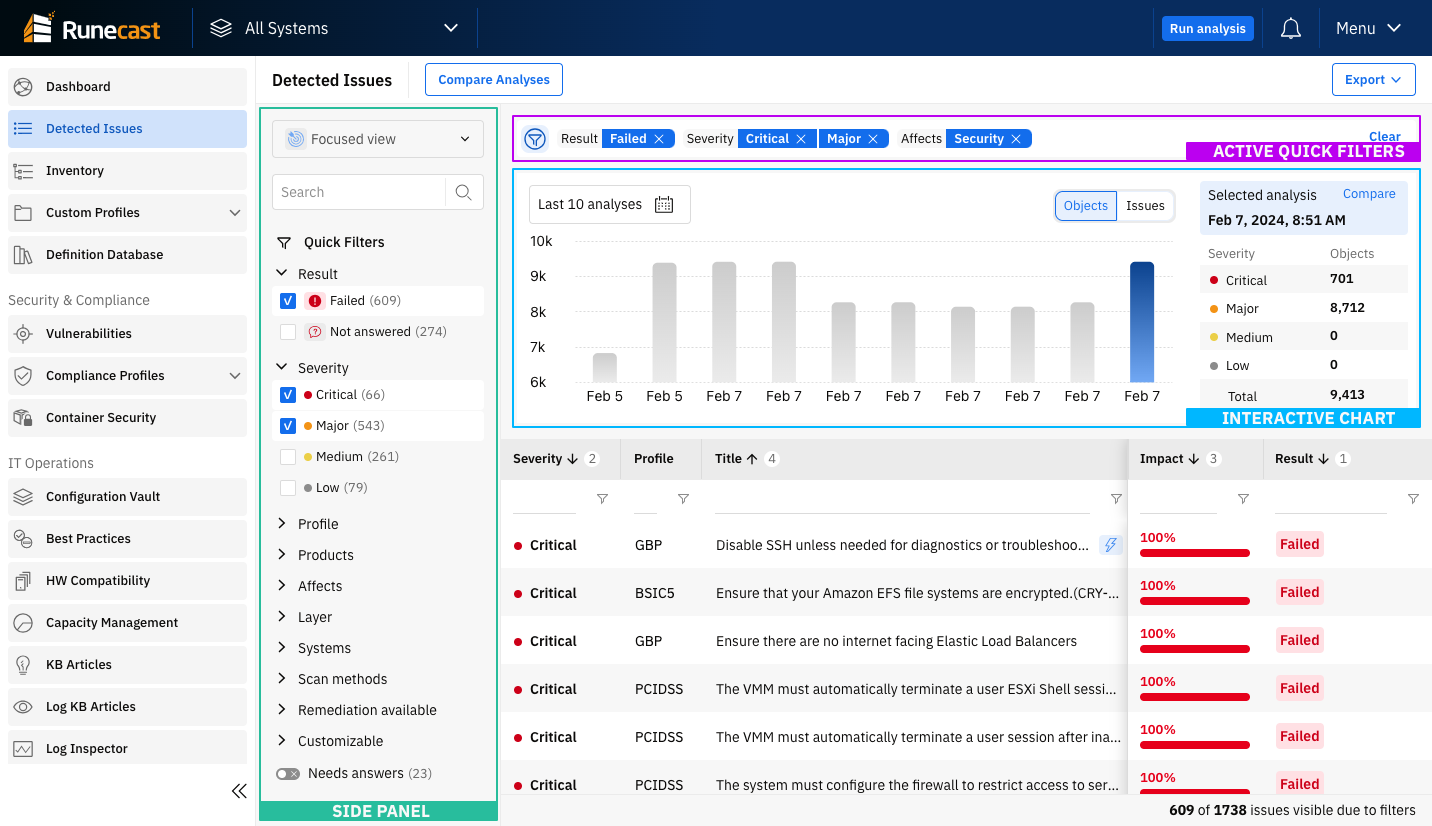
Detected Issues
This page combines detected issues from all knowledge profiles into a single view with the result table and historical chart. By default, the latest scan results are displayed. Everything can be customized using quick filters and/or selecting a scan from a specific point in time.
The left side panel contains information about the selected View and Quick Filters. The view controls the scope of issues listed in the table based on their results. Search input and quick filters can be used to filter the issues in the table and the chart quickly. Active search and quick filters are displayed above the chart, and they are also included in the URL so they can be shared easily.
The Export button provides the option to export the results in different formats (PDF, DOCX, or CSV) with various options for the level of detail.
The history chart is provided to visualize the number of detected issues or affected objects over the last ten scans (use the Objects/Issue switch to select the desired visualization). Each scan is represented by a bar and can be selected to view the full results.
Compare Analyses
The All Issues View page is an entry point to perform a comparison between any two analyses. To do so:
- Click on the Compare Analyses button
- Select desired analyses for comparison - by default the latest and the one before it are pre-selected
- Click on the Compare button
- You can see differences between both analyses for each issue
- Click on any issue in the comparison list in order to see a complete list of all objects and their states in both analyses
- From the top of the page you can change the analyses to compare or close the comparison page
Image Scanning
When at least one Kubernetes cluster is connected to Runecast Analyzer the Image Scanning option will appear in the menu. This functionality allows you to scan container images on-demand and also use it as a webhook for kubernetes admission controller configuration.
Supported image repositories
If an image is specified without a full URL to its location it will be pulled from https://hub.docker.com/ repository.
Other supported container image reposiories are:
- Non-authenticated repositories
- Custom CA signed repositories need to have the certificate trust added to the Runecast Analyzer appliance
Manual scan
Click on the Scan image button, provide a container image name and confirm your action with the Scan button in the dialog.
Tip
Optionally, select an *admission policy* that will be evaluated as part of the image scan. The policy evaluation result will appear in the main table and also in the scan details modal.
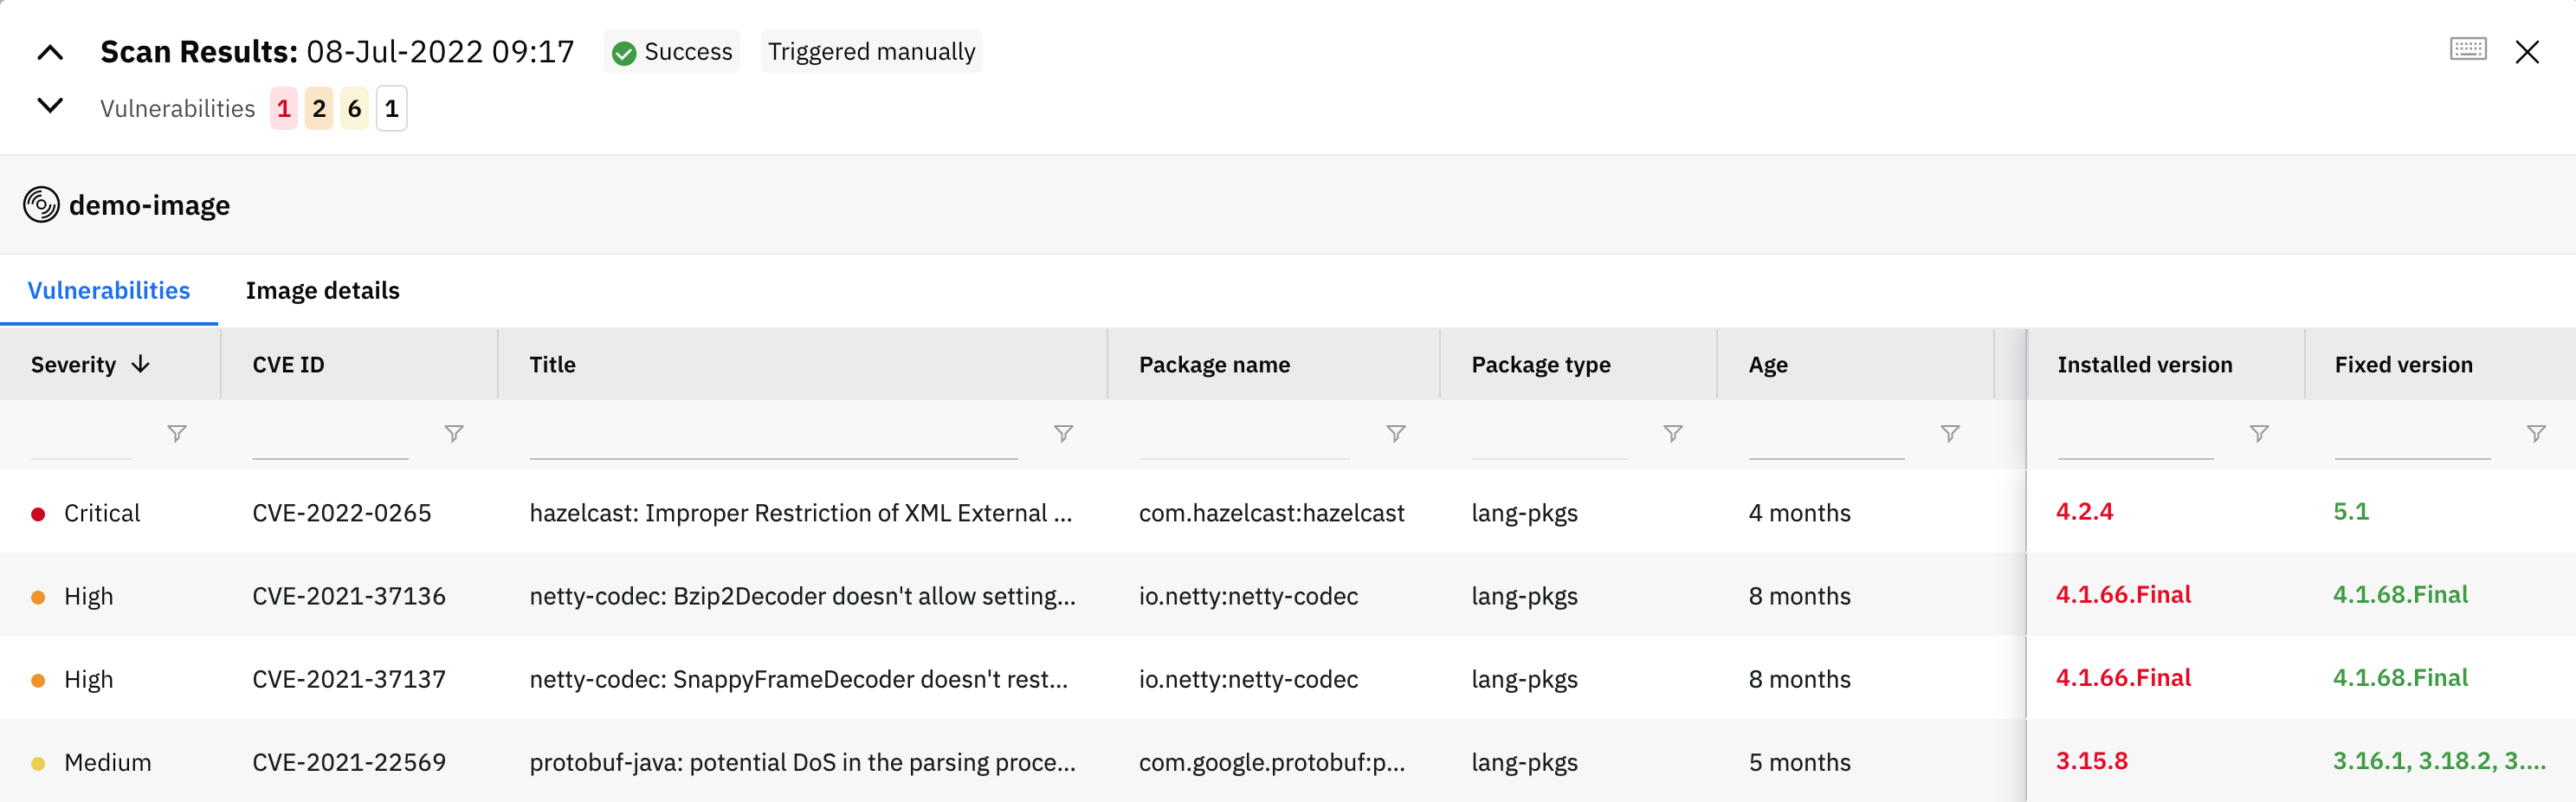
Select a scan from the main table to review the result details. The modal displays found vulnerabilities and also general image configuration.
Kubernetes integration
Runecast Analyzer provides an API endpoint which can be used as a webhook in a Kubernetes admission controller configuration:
https://<runecast-address>/rc2/api/v2/k8s-admission-policy-review/policy/{policyId}
where, the {policyId} is the ID of one of the predefined admission policies.
As any other endpoint in Runecast Analyzer, the request has to be authenticated. Make sure to generate an API Access token of access type Global Admin and configure the Kubernetes admission controller to use bearer token type of authentication for the webhook.
The response from the API endpoint will either allow or deny deployments based on the selected policy. Image scans triggered via kubernetes admissions controller are also visible in the Runecast Analyzer Image Scanning UI. They can be easily discovered based on the Trigger type column data.
To find out more on how to configure Runecast as a Kubernetes validating webhook including step-by-step guide, please see the Kubernetes Integration Examples chapter.
Public API
It's possible to trigger a scan of one or multiple images via the Runecast public API.
curl -X POST -H "Authorization: <your API token>" -H "Content-Type: application/json;charset=UTF-8" https://<appliance IP>/rc2/api/v2/images-scan-requests -d '{"imageNames": ["<image1>","<image2>"],"policyId": 1}'
Note
The policyId parameter in the payload is optional and if specified the scan result will be evaluated against the selected predefined admission policy.
The result of the above API request will look like the following:
{
    "imagesScanId": 454,
    "imageNames": [
        "<image1>",
        "<image2>"
    ],
    "policyId": 1,
    "scanResultCompliesWithPolicy": false
}
imagesScanId a further API call can be made to get the complete results:
curl -X GET -H "Authorization: <your API token>" -H "Content-Type: application/json;charset=UTF-8" https://<appliance IP>/rc2/api/v2/images-scans/{imagesScanId}
The response of the above API request will contain detailed information about the overall status and also for each image scanned.
Scans triggered via the public API will be visible in the UI as API trigger type.
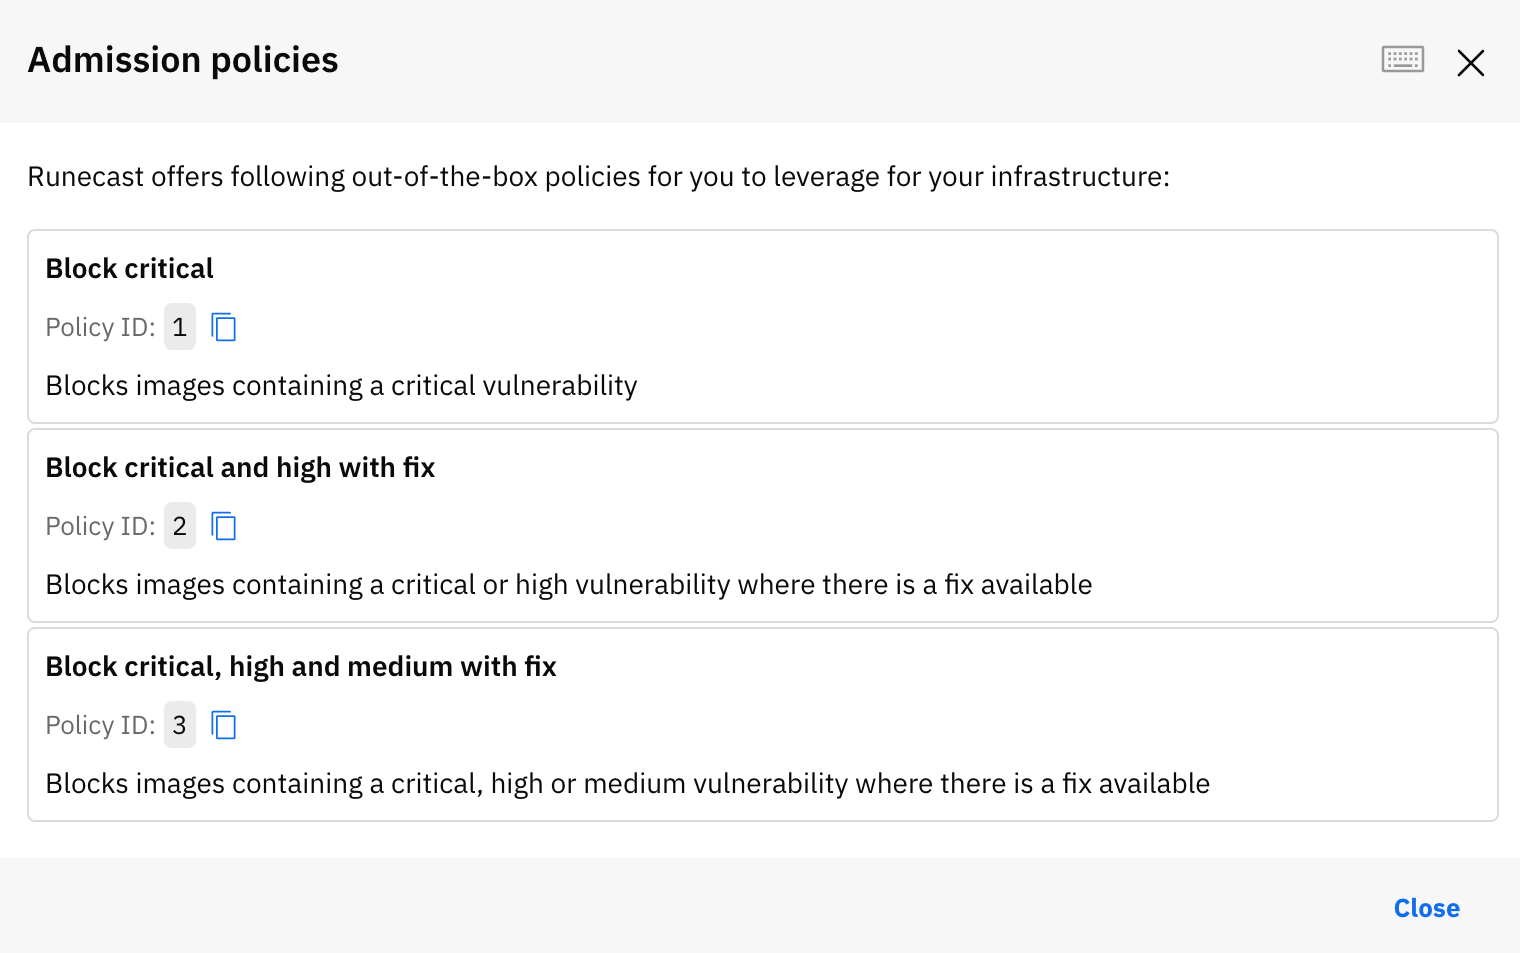
Admission policies
Runecast Analyzer comes with a predefiend set of admission policies that can be used to evaluate the result of an image scan. They can be used as part of the manual image scan or via the webhook used in the kubernetes admission controller.